Toolbar
Toolbar is located in
the topmost section of the screen.

Toolbar consists of
three tabs on the left side, and Buttons Info and Localization located in the
far right. The tabs are
-
Home
-
Grid
-
Chart
Home
Tab
Home tab groups common
functionalities.
|
|
Undo |
Undo the last change to the Analysis. Undo levels are
infinite. |
|
|
Redo |
Redo the undone change to the
Analysis. |
|
|
Settings |
Shows dropdown menu with two items – Show Tooltips (in Cube Explorer,
show/hide information about tree element on mouse over) and Show Icons on
Grid. |
|
|
New |
Opens New Analysis (Connection) dialog (see Figure 3-13). In the
dialog, you can either load previously saved connection from a drop down
menu Connections, or you can
create a new Analysis / Connection by providing connection parameters such
as Analysis Name, Data Provider, Server Type and so
on. |
|
|
Properties |
Change the name of the Analysis. |
|
|
Open |
Opens Repository Explorer (see the Chapter on Repository Explorer
later in this document for details). |
|
|
Save |
Saves current Analysis using Repository Explorer (see the Chapter
on Repository Explorer later in this document for
details). |
|
|
Clear All |
Resets a current analysis. Note: this action can be
undone. |
|
|
Cell Properties |
Opens Cell Properties dialog. |
|
|
Execute |
Executes Analysis if the Designer is in Pause
mode. |
|
|
Play / Pause |
Sets execution mode. In the Play mode, the Analysis is
executed immediately after any change has been made (i.e. an element has
been added to or removed from the axes). In the Pause mode, the Analysis is
executed on the user's request by clicking button Execute in the
toolbar. |
|
|
Open in New Window |
Makes a copy of a current Analysis in the Designer, change it's type to Dynamic
document, and opens it in a DocumentViewer. |
|
|
Show Grid |
Show the Analysis in the grid only. |
|
|
Show Grid and Chart |
Shows the Analysis as both grid and the
chart. |
|
|
Show Chart |
Shows the Analysis in the chart only. |
|
|
Export to PDF |
Exports the current Analysis to PDF
Document. |
|
|
Export to Excel |
Exports the current Analysis to Excel Document. Drop down menu
allows you to choose the version of Excel (Currently supported are the
versions Excel 97-2003 and Excel
2007) |
|
|
Info |
Shows some basic information about current Analysis (Server,
Database, Cube, the number of rows / columns /
cells). |
|
|
Localization |
Allows you to change the language of the application. Currently,
only English and Croatian languages are
available. |
Grid
Tab
Grid tab groups grid
related properties. Grid needs to be enabled in Analysis for these buttons to be
enabled. To enable grid, click View
Table button or View Table and Chart
button on the Home
Tab.
|
|
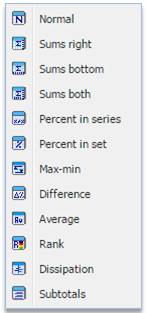
Grid Settings |
Shows drop down menu with various grid options. See Figure
4-3. |
|
|
Swap Axes |
Swaps elemens from
the rows with elements from the columns, and vice
versa. |

Chart
Tab
Chart tab allows you to
choose from one of the seven types of the chart. Chart needs to be enabled in
Analysis for these buttons to be enabled. To enable chart, click View Table and Chart button or View Chart button on the Home
Tab.
|
|
Bars |
Show Chart as bars |
|
|
Stacked Bars |
Show Chart as stacked bars |
|
|
Lines |
Show Chart as lines |
|
|
Pie |
Show Chart as pie |
|
|
Area |
Show Chart as area |
|
|
Polar |
Show Chart as polar |
|
|
Radar |
Show Chart as radar |
 Analysis on new conenction